Appearance

Charts
QuestPDF integrates seamlessly with the ScottPlot library to provide powerful charting capabilities in your PDF documents. This integration leverages vector graphics through dynamically generated SVG content, ensuring your charts remain sharp at any scale.
INFO
This section provides examples of how to integrate the ScottPlot library with QuestPDF. This library is available under the "MIT" license.
We extend our thanks to the authors and maintainers of that project for their contributions to the open-source community.
WARNING
Please note that the ScottPlot library is not included in the QuestPDF package. You need to install it separately via the NuGet package manager.
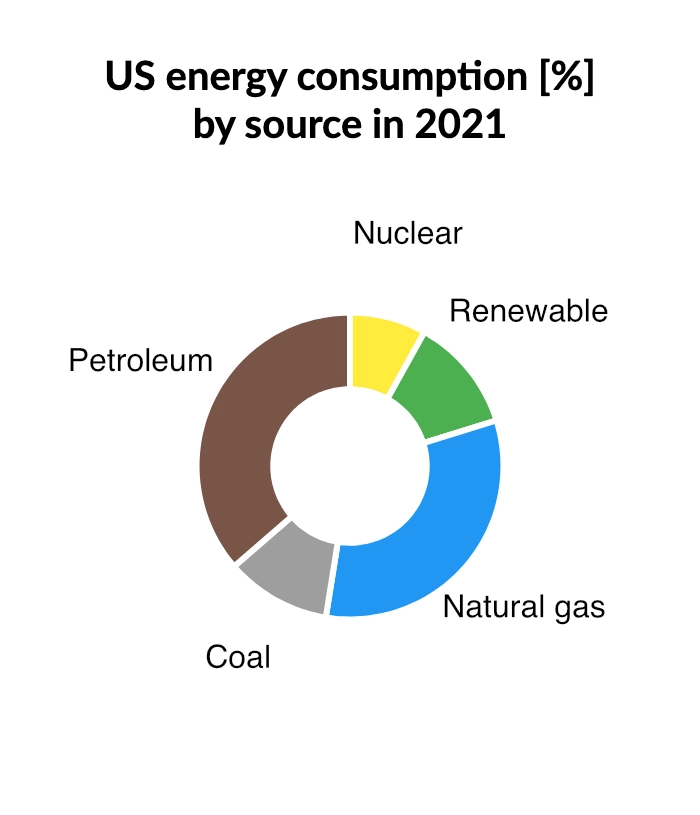
Pie Chart
Below is a sample layout showing U.S. energy consumption by source in 2021. ScottPlot is responsible for creating the SVG string, which QuestPDF then embeds in the PDF.
csharp
using ScottPlot;
using Colors = QuestPDF.Helpers.Colors;

// somewhere in your document's implementation
.Column(column =>
{
    column.Spacing(10);

    column.Item().Text("US energy consumption [%]\nby source in 2021").AlignCenter().Bold();

    column.Item()
        .AspectRatio(1)
        .Svg(size =>
        {
            ScottPlot.Plot plot = new();

            var slices = new PieSlice[]
            {
                new() { Value = 8, FillColor = new ScottPlot.Color(Colors.Yellow.Medium.Hex), Label = "Nuclear" },
                new() { Value = 12, FillColor = new ScottPlot.Color(Colors.Green.Medium.Hex), Label = "Renewable" },
                new() { Value = 32, FillColor = new ScottPlot.Color(Colors.Blue.Medium.Hex), Label = "Natural gas" },
                new() { Value = 11, FillColor = new ScottPlot.Color(Colors.Grey.Medium.Hex), Label = "Coal" },
                new() { Value = 36, FillColor = new ScottPlot.Color(Colors.Brown.Medium.Hex), Label = "Petroleum" }
            };

            var pie = plot.Add.Pie(slices);
            pie.DonutFraction = 0.5;
            pie.SliceLabelDistance = 1.5;
            pie.LineColor = ScottPlot.Colors.White;
            pie.LineWidth = 3;

            foreach (var pieSlice in pie.Slices)
            {
                pieSlice.LabelStyle.FontName = "Lato";
                pieSlice.LabelStyle.FontSize = 16;
            }

            plot.Axes.Frameless();
            plot.HideGrid();

            return plot.GetSvgXml((int)size.Width, (int)size.Height);
        });
});
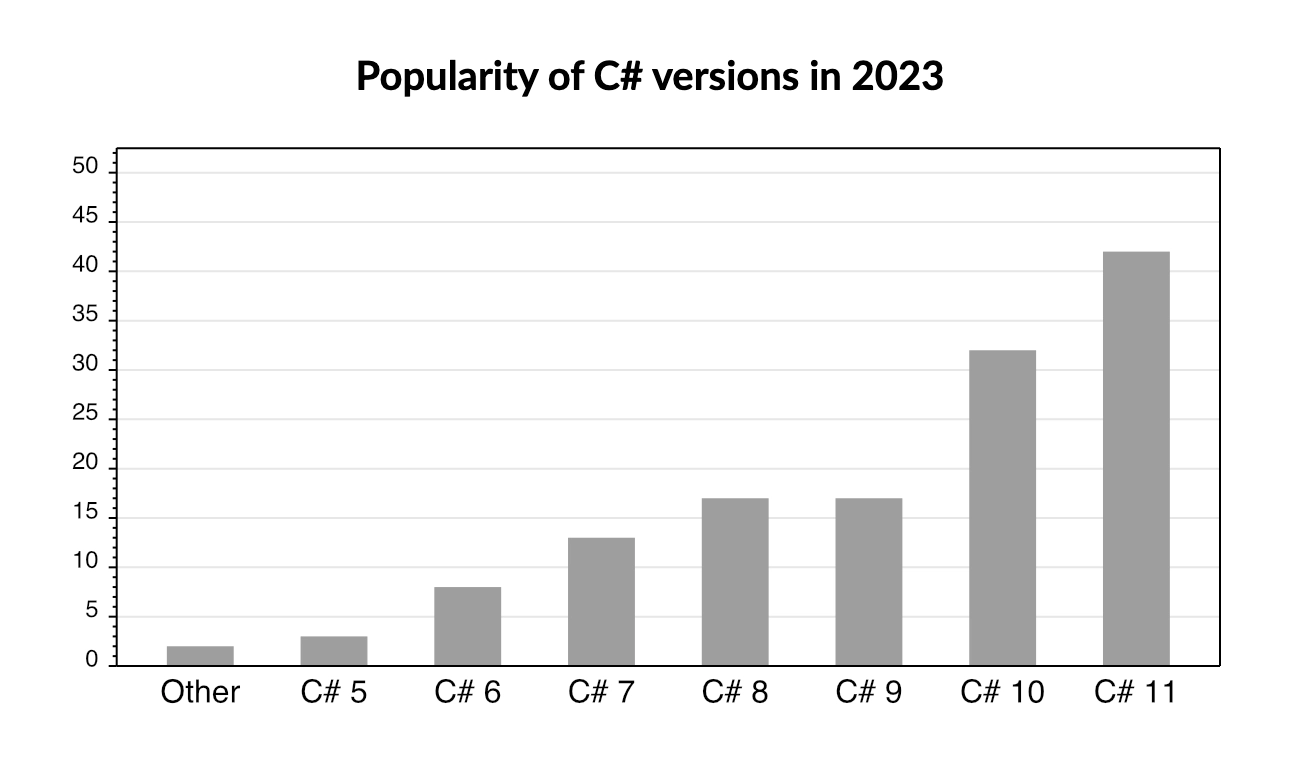
Bar Chart
This example creates a bar chart showing the popularity of various C# versions in 2023. Source
csharp
using ScottPlot;
using Colors = QuestPDF.Helpers.Colors;

// somewhere in your document's implementation
.Column(column =>
{
    column.Spacing(10);

    column.Item().Text("Popularity of C# versions in 2023").AlignCenter().Bold();

    column.Item()
        .AspectRatio(2)
        .Svg(size =>
        {
            ScottPlot.Plot plot = new();

            var bars = new Bar[]
            {
                new() { Position = 1, Value = 2 },
                new() { Position = 2, Value = 3 },
                new() { Position = 3, Value = 8 },
                new() { Position = 4, Value = 13 },
                new() { Position = 5, Value = 17 },
                new() { Position = 6, Value = 17 },
                new() { Position = 7, Value = 32 },
                new() { Position = 8, Value = 42 }
            };

            foreach (var bar in bars)
            {
                bar.FillColor = new ScottPlot.Color(Colors.Grey.Medium.Hex);
                bar.LineWidth = 0;
                bar.Size = 0.5;
            }

            plot.Add.Bars(bars);

            Tick[] ticks = [
                new(1, "Other"),
                new(2, "C# 5"),
                new(3, "C# 6"),
                new(4, "C# 7"),
                new(5, "C# 8"),
                new(6, "C# 9"),
                new(7, "C# 10"),
                new(8, "C# 11")
            ];

            plot.Axes.Bottom.TickGenerator = new ScottPlot.TickGenerators.NumericManual(ticks);
            plot.Axes.Bottom.MajorTickStyle.Length = 0;
            plot.Axes.Bottom.TickLabelStyle.FontName = "Lato";
            plot.Axes.Bottom.TickLabelStyle.FontSize = 16;
            plot.Axes.Bottom.TickLabelStyle.OffsetY = 8;
            plot.Grid.XAxisStyle.IsVisible = false;

            plot.Axes.Margins(bottom: 0, top: 0.25f);

            return plot.GetSvgXml((int)size.Width, (int)size.Height);
        });
});