Appearance
Implementing charts
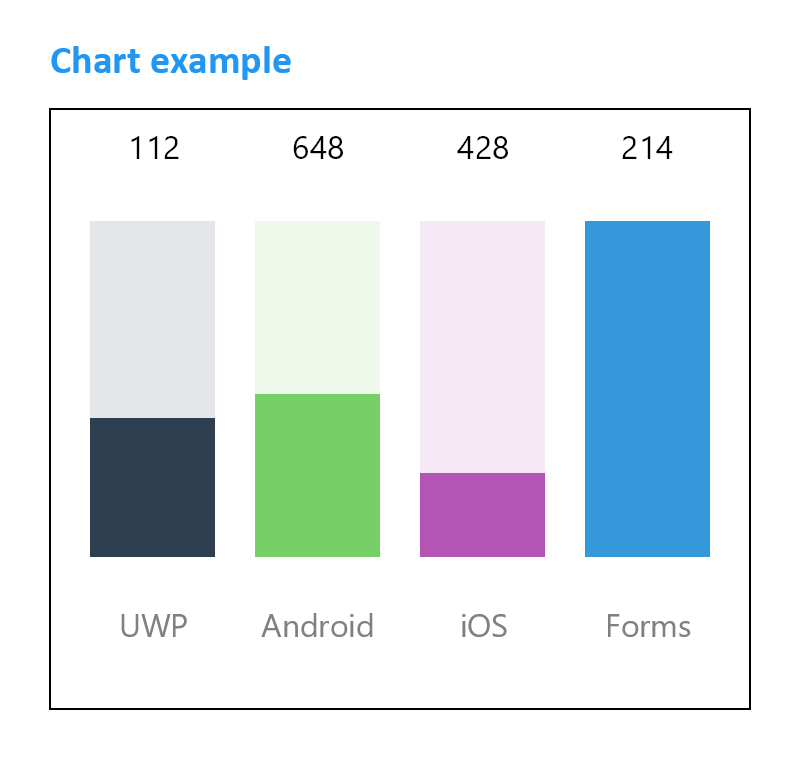
There are many ways on how to implement charts in the QuestPDF documents. By utilizing the Canvas element and SkiaSharp-compatible charting libraries, it is possible to achieve vector charts.
Please analyse this simple example which utilizes the microcharts library.
TIP
The microcharts library is available under a permissive MIT license. More information can be found on its official GitHub page or NuGet page.
Please consider giving them a star on GitHub.
WARNING
This functionality relies on the SkiaSharp library and the additional integration layer. Please read more about it in the SkiaSharp integration section.
c#
// prepare data
var entries = new[]
{
    new ChartEntry(212)
    {
        Label = "UWP",
        ValueLabel = "112",
        Color = SKColor.Parse("#2c3e50")
    },
    new ChartEntry(248)
    {
        Label = "Android",
        ValueLabel = "648",
        Color = SKColor.Parse("#77d065")
    },
    new ChartEntry(128)
    {
        Label = "iOS",
        ValueLabel = "428",
        Color = SKColor.Parse("#b455b6")
    },
    new ChartEntry(514)
    {
        Label = "Forms",
        ValueLabel = "214",
        Color = SKColor.Parse("#3498db")
    }
};

// draw chart using the Canvas element
.Column(column =>
{
    var titleStyle = TextStyle
        .Default
        .FontSize(20)
        .SemiBold()
        .FontColor(Colors.Blue.Medium);

    column
        .Item()
        .PaddingBottom(10)
        .Text("Chart example")
        .Style(titleStyle);

    column
        .Item()
        .Border(1)
        .ExtendHorizontal()
        .Height(300)
        .SkiaSharpCanvas((canvas, size) =>
        {
            var chart = new BarChart
            {
                Entries = entries,

                LabelOrientation = Orientation.Horizontal,
                ValueLabelOrientation = Orientation.Horizontal,

                IsAnimated = false,
            };

            chart.DrawContent(canvas, (int)size.Width, (int)size.Height);
        });
});
This is a result: